Design a site like this with WordPress.com
Get started
Featured

Breaking down … Expected goals

What are Expected Goals

Expected goals or xG (which I will refer to it as for the rest of the break down) have gained a lot of negative and positive press recently from its appearance on Match of the Day, a leading British TV programme which shows the highlights of all of the Premier League games. Comments from pundits and former players have been very mixed with some arguing that the use of these statistics have ruined the essence of the game whereas others argue that it is another significant step towards quantifying the intricacies of football.

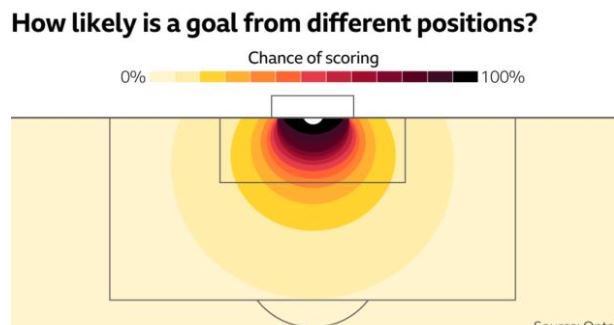
So, what does the term expected goals actually mean. It is essentially a tool that can be used to help understand a game better by measuring the quality of shots that each team takes. The simplest xG models do this by simply assessing the location of each shot taken and the likelihood of a shot from that position leading to a goal. To find this probability the model looks at a historical data set of lots of shots from many positions and which shots lead to goals.

This simple shot location diagram forms the backbone of the XG model and shows that the angle that a shot is taken from greatly influences its XG.

Why are Expected Goals important

xG shows us how many goals you would expect a team to score from the shots they have taken, however, shot location is not the only factor that contributes to the final xG value for that shot. Other factors include whether the shot was taken with the foot or with the head (headers have a lower xG as they statistically are less likely to result in goals), the type of pass leading to the shot e.g. cutback, cross, through ball, whether the player went around the keeper or not and the speed of the attack that leads to the shot. One big advantage of xG is it can help to counteract the often-misleading shot numbers of a player. For example, here we will compare Jonjo Shelvey and Romelu Lukaku’s shot location for the 2018-19 season.

Here you can clearly see that a large majority of Lukaku’s shots are taken from inside the box whereas this is the opposite for Shelvey who often takes shots from outside the box. Last season Lukaku was taking 2.34 shots per 90 and Shelvey was not far behind on 2.22. In previous years without xG data, scouts could have been misled to believe that both players provide a similar attacking output with comparable shot numbers. However, the xG model understands that Lukaku is taking shots that are statistically much more likely in resulting in a goal with Shelvey only having an xG on 0.07 per 90 compared to Lukaku’s 0.56. Doing this comparison between shot numbers and xG can give scouts valuable insight into a player. For example, high shot numbers with low xG numbers could suggest that:

  1. The player lacks match intelligence and continues to persist long shots despite being a low percentage option for even the players with the best finishing abilities.
  2. The team around the player is weak at chance creation so a more deep-lying player may feel obligated to shoot from further away from goal.
  3. The player may lack the skills to get inside the box and shoot.

Using Harry Maguire’s shot location diagram (who is known to only really score from headers) shows how the xG model is also able to differentiate from headed and footed shots. Despite taking a considerably high 1.04 shots per 90 for a centre back his xG per 90 is only 0.06 showing how these chances are usually of little quality. Maguire is known as being a real threat in the air however, and last season he was able to outperform his xG scoring 3 goals whereas xG had him at 1.86, reflecting his quality in the air. Expected goals can not only be used in an attacking sense but also in a defensive sense as well to show the quality of a defence or goalkeeper.

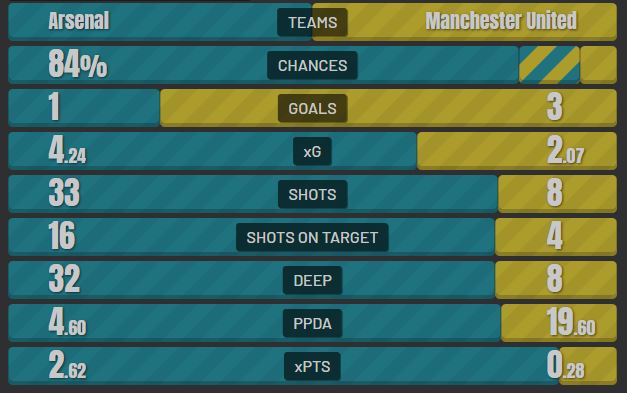
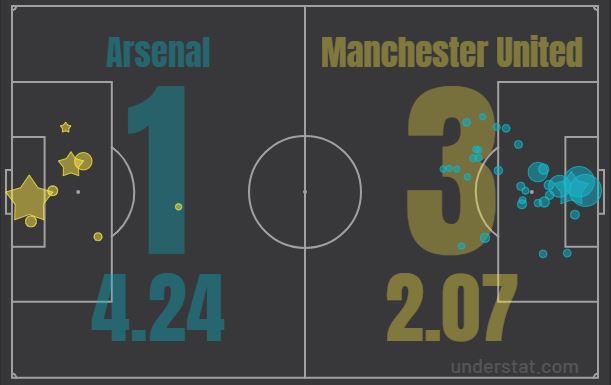
I have chosen the game between Arsenal and Manchester United on December 2nd 2017 to highlight the importance of xG as a statistic defensively. In this game David De Gea was insane giving one of his best performances in his career making a monumental 14 saves in the game, equalling the premier league record. To watch De Gea’s heroics, use this URL: https://www.youtube.com/watch?v=tH4I8qM_4Eo. In this game, despite United winning 3-1, Arsenal dominated the game taking 33 shots with 16 on target. The xG model in this case almost acts like a football fan understanding that Arsenal were unlucky to lose this game and goes as far as to suggest that a more fitting scoreline based on the quality of the chances would have been 4-2 to Arsenal. This indicates clearly to a scout that the goalkeeper has severely overperformed xG in this game and has won the side the game. These statistics can also be used to critically evaluate your own team, with this result showing that the defence was poor this game and should be an area that should be looked to be improved in the upcoming transfer window or by promoting promising youth squad members to the first team.

De Gea vs Arsenal

xG is in fact better at telling you the quality of a player or the quality of a team than goals itself. Imagine a scenario where in the first 10 games of the season, team A may go on a hot streak scoring several 40-yard screamers to clinch them games and find themselves top of the league. Team B may be placed second and scored far fewer goals but very easily their xG measure could be much higher Team A’s. Expected Goals supports and benefits consistent high-quality chance creation and this is almost always indicative of a much higher quality side. In the scenario of Team A and Team B, by the end of the season, logic suggests that you would expect to find Team B finish on the most goals as they are the side that are able to build up attacks to the point of a tap-in in the six-yard box.

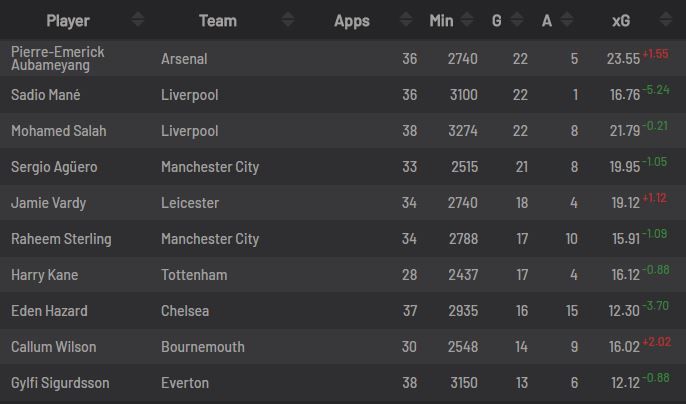
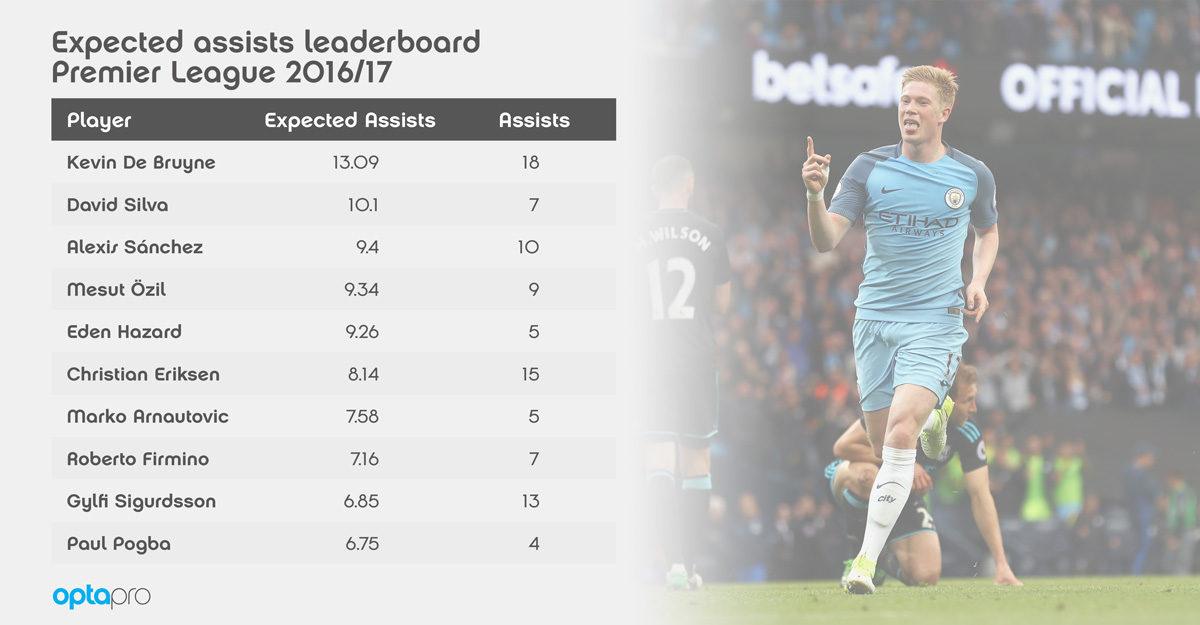
Looking at the top scorers from the Premier League and comparing their xG and actual goals you can see that they are not far off at all, showing how xG has an ability to match and mimick real life results. The top scorers list does tend to feature the people who have overperfomed xG the most as they were those who were able to finish the difficult chances in order to make the list. For example Sadio Mané, who was an extremely prolific finisher this season, overperformed his xG by by 5.24. For most other players, the xG metric is much closer as the top scorers tend to have had supercharged seasons with purple patches in order for them to reach the top scorers list.

Limitations of the Expected Goals metric

As with all statistics, there are some limitations of the xG model, the first being that it does not take into account or differentiate in any way the finishing ability of the player as introducing player identity leads to reduced accuracy of the comparison. It is difficult to put a qualitative measure on a player’s finishing ability other than looking at goals which as explained before could be misleading. If a player scores many goals but a majority of those are tap ins then it gives no indication as to how prolific the player really is in front of goal. Undeniably, finishing ability does exist and this can clearly be observed when watching Luis Suarez compared to Jozy Altidore. On the other hand, through the xG model, many scouts have been able to realize what truly makes a forward great. In the grand scheme of things, the ability to get high-quality chances close to goal is what makes them special not finishing those chances at an above-average rate.

Most xG models do not take into account traffic data either i.e. how many defenders are between the person taking the shot and the goal. Some models do contain this data such as Stratabet’s but most including the most well-known xG model created by Opta, do not. Through balls and counter-attacks are built in the model to loosely adjust for this as it indicates how set the defence is. Sean Dyche and Lucien Favre often tend to overperform xG defensively as they employ tactics that mean that they get several men behind the ball and their teams average some of the highest number of blocks in Europe’s top five leagues. Unfortunately the xG metric is no able to factor this data in yet but steps are being taken to incorporate this data in newer models.

How Expected Goals are being used

Football fans are already somewhat using the idea of xG when assessing whether their team was lucky or unlucky to win a game based on the quality of chances they had. In a way, the video game FIFA uses it’s own xG model with players much more likely to score close to the goal than far away from it. Top tier football clubs are using the xG metric to help their scouting and to make judgements on their own team. Some clubs that have openly advocated the use of xG include:

  • Arsenal
  • Liverpool
  • Borussia Dortmund
  • Paris Saint-Germain

The xG statistics help scouts to whittle down a large dataset of many exciting prospects into a shortlist of players which can then be further scouted in person. Betting companies use xG data to help set odds and professional betters use xG data to their advantage to exploit more naive companies that do not use the metric.

Whether you like the idea of expected goals or not, the metric will inevitably be used more and more given how simple yet effective it is. Most importantly it continues to improve, factoring in more and more variables with newer and improved models without tarnishing the spirit of the beautiful game.

By Anmol Gupta

Advertisement

Breaking Down … An F1 Metric

Statistics are starting to be integrated into more and more sports and we have discussed its increasing use in football in many previous blogs. Perhaps the hardest sport to try and integate statistics into is Formula 1 as assessing driver competency is extremely dificult due to the vastly varying levels of the car.

To understand why the different cars vary so much, we need to delve deep within how funding works in F1. In 2017, the top earning team made almost 10 times the amount of the lowest earner. It simply does not boil down to the constructors championship as many people believe as there are a variety of other factors to consider. The first funding a team recieves is $36 million if the team has been classified for at least 2 of the previous 3 seasons. In 2017, this bonus was recieved by everyone except a new team, Haas F1, Putting them well behind their competition already with the bonus equating to 240 front wings. The teams then get payed according to their standing in the constructors championship ranging, with Merceded recieveing $61 million for winning the championship.

The next source of revenue is known as Long-Standing-Team or LST for short. In 2017, Ferarri were the only team to recieve this bonus of $68 million. As well as some other hefty bonuses that Williams, McLaren , Mercedes and Red Bull recieve for different reasons. The final finances look something like this:

As you can see here there is a lage disparity between the top 3 teams of Ferrari, Mercedes and Red Bul who can dominate other teams due to their much larger revenue streams . You can also see how difficult is for a new team to posper in F1 as can be seen in the extremely limited revenue that Haas recieve.

Obviously the drivers in the slower cars in the midfield and back of the grid will be at a severe disadvantage to those who drive the Ferraris and the Mercedes wih their top spec power units and extreme downforce cars. So how can drivers be ranked fairly, factoring in their car performance, and what is the obsession and importance with ranking these drivers.

Well first off the importance of being able to measure driver performance in the fairest way possible lies within the whole seat system of F1. Every year drivers are fighting with each other to secure the limited 20 seats that F1 has to offer. Not only are they battling the current F1 drives but also up and coming drivers from F2, F3 and drivers from the Junior driver academies of the different constructors. Because of this each drivers greatest cmpetiton has typically been their teammate as they are both in the same car so comparison an be made between the two easily as to who is the better driver. Why the statistics regarding driver performance is so important is that say a driver is droppped by a team, a different team may want to sign the driver who has just been sacked, but for them to compare it to the drivers they currently have would be very difficult as they were both in different cars, making the decision extremely subjective.

So what factors should be considered when assessing the ability of an F1 driver. It can be broken down into two basic categories, race performance and qualifying performance. Both are impotant as qualifying shows how fast the drive can be when pushing to the absolute limit, almost giving an idea of the potential of the driver. The race shows whether has the focus and enduance to sustain a high level for long periods of time and ultimately the points or the team are won in the race and not qualifying. This would mean that if we were to create an algorithm in order to try and rank the drivers that final qualifying position would have to be factored in, both in relation to the teamate as well as the general grid positon. Furthermore the race finish would have to have a slightly higher weighting in comparison to the qualifyng position as this obviously has more importance.

Delving deeper into how we could score drivers in the algorithm based on race finsh begs the question whether it should be done using points scored or simply just from driver position in the grid. Obviously points scored is what counts in the end but this can often be misleading. For example looking at the 2019 F1 season George Russel has been dominating his teamate Robert Kubica, beating him every single qualifying session and finishing above him almost every race. However as both drive for current backmarker’s Williams, Kubica is ahead of Russel in the driver’s championship as h has scored 1 point and ussel has not yet so far despite his highly promising rookie season.

If we are looking at complete driver performance then we obviously need to facto in some consideration of how fast the car really is and how much the drivers have been able to utilise the car that they have been given as it would obviously not to blindly compare points scored for one of the Ferrari drivers with one of the Torro Rosso’ s. Perhaps one way o doing this would be to really analyse the staistics o the car through winter testing. Yes this data is not readily avaliablebyt say this data was given to an FIA regulaed body and or the eyes of no one else then perhaps the teams would be happy to share this. Another way perhaps of assessing speed of the car is though the use of simlation, taking data such as max speed and downfoce into account by looking at laps done by drivers. You could even get one driver to test each car and compare those lap times in order to analyse how fast the cars really are.

Another factor which will certainly need to be considered is the reliaibility of the car and if retirements are caused simply due to mechanical failures then perhaps the effect of the final postion on the score of the driver for that weekend could be lowered or pehaps the score for that race could just be ignored. Often retirements are cause by reckless driving where you may hit a kerb and damage he suspension, then race postion shoud be considered as it also comes down to driver skill to see if they can recover using a damaged car.

Crashes are another big part of the adjustment of the race position and is one of the key areas where subjectivity will have to be incorporated between the algortihm. Perhaps a multiplier culd be used from 0 to 1 based on how at fault the driver was. For example :

Looking at the first crash in this video there are a number of cars involved in this. If we were to spread the blame of the crash with the total blame of all the cars involved in the crash being 0 to 1 then Raikonnen and Vettel would have to share a large poportion of the blame their perhaps 0.5 for Raikonnen and 0.4 for Vettel. Verstappen seemed fairly helpless in that incident but perhaps could have braked and given in so 0.1 of the blame lies with him. The other two cars of Alonso and Riccardo that Raikonnen collides into really have no liability for this crash whatsoever so would ecieve some sort of bonus to the score or that wekend as it simly was not their fault that they got caught up in a racing incident that jeprodized their race.

Another thing to consider is age and experience for a team who may be looking to decide whether they go forward with a current driver or not. There are many ways to jusge this, perhaps by looking at the age of world champions or by looking at the mean points scored in the driver’s championship for 20 year olds in the hybrid era, then 21 year olds, then 22 and so on to almost predict how the development of a racing driver is on average. Perhaps the progress of the current driver could be compared to the standard cuve over what data is avaliable and it can be seen whether they are above or below that ranking. Obviously there are many flaws and assumptions involved in this such as the driver may have a worse car the next year so despite them seemingly getting worse by getting less points their skill as a racing driver may have drastically improved. Also a small sample size for the extreme ends of the spectrum would restrict how accurate we could possibly be. There could also be some sort of rookie bonus for drivers in their first year of F1 as this is a paticulaly tough year or drivers as they enter a new sport. In the end, this measure would be more useful or teams deciding on driver lineups or he next season and should not be included in the aim to objectively measure driver performance.

In the end, F1 is an extremely unfair and dominated sport, with very year in the hybrid era, mercedes have won both the driver’s and constructor’s championship. Although Ferrari and Red Bull can keep them on their toes the rest of the teams in the midfield and at the back of the grid have really struggled to keep up with the big three due to thei budgets being no way near comparable. To try and eliminate this differnce in car and to just simply understand how good the driver is behind the wheel would be extremely imprtant. It could almost be used as another measure that divers fight for like the diver’s p constuctors championship. It highights the work of drivers towards the back of the grid who may not get the plaudits they deserve as their cars restict them from getting anywhere nea the podium or race wins.

Simply this measure would be good for the teams to help rate their drivers, it gives all the drivers a fair and even playing field to compete from and it helps the fans to understand who truly are the best drivers in the paddock. Funding could also be given to teams based on their performance on this metic which would help to lower the disparity in budgets towards the teams, also hlping new teams to suvive in Formula 1, leading to moe intense racing for fans to enjoy and more competition, forcing teams to up their game. This metric could be revolutionary for F1

Why being lucky is half the battle in Football

Luck seemingly repesents the antithesis of what statistics try to achieve. A concept with connotations of random chance and a quantity which most people would assume is an external factor that prohibits the sense of regularity that make statistics so powerful. Luck seemes like the tool which would always play on the mind of someone when predicting the outcome of a football match. But can it be accounted for? If so, how?

Skill is something that defintively exists in football. The void in skill can clearly be seen when comparing your average Sunday league player to the elite regularly featuring in the nation’s top league. But even within the top leagues where only the best can make it, a void still exists with talent levels clearly differing, between clubs and between leagues.

We can highlight one example of luck in the Premier League by looking at a game in 2009, where Darren Bent, at the time a Sunderland striker, was able to score from a rather tame shot against Pepe Reina in the Liverpool goal. In fact, the Spanish goalkeeper had not been to blame for this and the shot had take a nast deflection, but not from a player. In fact, the shot rebounded off a red beachball that had found its way on the pitch, wrong footing the keeper and confusing everyone in the stadium as well as everyone sitting at home. Liverpool found themselves 1-0 down and despite Liverpool taking 15 shots that game they couldn’t muster any points from the game. They had lost due to a beach ball.

Watch the action unfold here

Well how much of footall is based on skill then and how much of it is based on luck. If the game was pure skill then ultimately the best team would always end up winning, but we know that this is not always the case. If it was purely based on luck, then there would be no real division in points in the league and there would be no reason for teams to splash the cash on new signings or to develop their youth systems. Most academics have come to the conclusion that football consists of a 50:50 split between luck and skill, something which may be hard for any football purists reading to comprehend as they appreciate the intracicies of the beautiful game.

To further the football myths, the percieved beauty of a team, i.e the slick passes and long build up play leading to a finessed finish is no real measure for how objectively effective a team is, it is often just a by-product of a succesful team but is in no means what defines the success of a team. As many of us may have learnt, correlation does not indicate causation and this is a great example of this idea. The actual efectiveness of a team can be more accurately measured by looking at metrics such as ball retrieval, shot numbers and even as simply as goals. It is an objective fact, that the most succesful teams score more than others or concede less than others, usually a combination of both, however a beautiful style of play is most certainly not an indicator. The best example of this is Sir Alex Ferguson’s United who were a well drilled machine that would grind out results and always go fo the most pagmatic approach, which led them to winning 13 league titles in his tenure. A paticular example stands out when they played Arsenal in March 2011 and Sir Alex played 7 recognisd defenders in his starting line up against the visually pleasing Arsenal side, but still walked away with a 2-0 win.

If we were to look at bookmaker’s odds, the point behind this article is further illustrated. If we were to look at the success rates of pre-game favourites in a variety of sports in the 2010-11 season, in handball the bookmaker was corect 72% of the time, basketball 68%, american fooball 67%, baseball 61% and football sits right at the bottom of the pile with only a 52% success rate. This is other words, shows that bookies pick favourites less successfully in football alluding to the factor of luck or to be more scientific; random chance. Obviously the draw plays a significant part in the poor quality of predictions as this result is very common in football due to the rare nature of a goal, with the daw being a much less likely outcome in the other sports listed above.

When delving further into the odds we can almost classify the pre game favouits into two categories “strong” and “weak favourites”. To determine how much a favourite is advantaged over the opponent you can analyse the diffeence in odds between the favourites winning and the underdogs winning. In this we will define a strong favourite as one team’s oddds of winning as more than 2 times the other, suggesting, in an ideal world, if the two teams played three times then the favouite would for sure at least win twice and possibly win/draw or lose the other game. In football these strong favourites win only 65% of the time, less than the absolute minimum value according to the statistical theory, which would be 67%. In actuality it would be higher as in some cases the odds may be 3, 4 or even 5 times higher for on team than the other. In basketball the strong favourite wins 80% of the time, much closer to the value you would expect.

From these studies, including the one undertaken by Eli Ben-Niam from the Los Almos National laboatory, we can definitely conclude that football is the most uncertain of sports. According to Ben-Naim’s study above where he analysed 300,000 games and found that the chance of an underdog winning was 45.2%. However as established in the expected goals article, wins and even goals can be misleading. Even if you break it down to a statistics which is shots which we have established as one of the best indicators for determining the disparity in quality between sides, we can see that on average in Europe’s top five leagues the likelihood of the team that takes the most shots winning is only 47%, again hinting at that 50/50 proposition. Even if you use the even more precise metic of shots on target the tale is similar with teams that take more shots on target win only 55% of the time.

The real importance of this article however, is to show how football is rooted within statistics and chance. Within football we are seeing probability come to life and football fans need to acceptt that like so many other phenomenana that we see, football itself has this intrinsic random-element. Just like the decay of nuclei and the number you role on the dice, football also comes down to chance. In all these cases there are possible outcomes, either the nuclei decays or it doesn’t, you roll a 6 or you don’t you win or you don’t. Football seemingly comes down to probability as well, however unspurprisingly chance only takes into effect around 50% of the games. In half of the games we see the better side rewarded with the win. The other half comes down to the flip of a coin.

Why Aaron Wan-Bissaka is Manchester United’s best player

Aaron Wan-Bissaka has had a simply monstrous start to the season. Putting up a mamouth 5.6 tacles a game, Wan-Bissaka has silenced his critics which prviously mocked United for what was suggsted to be a vast overpayment for a young English talent showing glimmers of promise. His 5.6 tackles per 90 puts him top in the EPL this season with even the most labouring defensive midfielders such as the likes of Wilfred Ndidi, unable to match his remarkable output.

Whilst ability to pull off those perfectly timed “spiderman” challenges is now well known by the average football fan, many aspects of his game remain underrated. One of those is his dribbling ability, as his slick composure with the ball at his feet is most certainly one of his strongest assets. Attempting 2.4 dribbles per game, and completing 1.6 of them (giving him a better completion rate than Wilfred Zaha, highly rated for his dribbling), Wan-Bissaka has shown that he can be valuable in pushing the side forward and has the raw talent to beat a man. Making 1.2 interceptions and 1.8 clearances per 90, he has shown that he is able to dissect the game and really help to slow down the momentum of the team by winning the ball back or clearing the danger.

If you were to ask any United fan what their greatest issue was last season it would almost undoubtedly be their right hand flank. An ageing Ashley Young was thrown in out of position into the right back role with the added pressure and responsibility of the captain’s armband and United simply didn’t have a stable right wing option. With the addition of Wan-Bissaka and Daniel James ahead of him, United have looked much more lethal on that side both going forwad and in defence with the right hand channel being more defensively and ofensively productive this season for United than the left, this was certainly not the case last year.

Looking at Ashley Young’s stats from last year paints a clear picture of the discrepency in quality between him and Wan-Bissaka. Young averaged 0.3 tackles and 1 interception per 90 showing his lack of that intrinsic awareness top quality defenders have to win the ball back. He averaged 2.7 clearances per 90 which suggests he was required to do more last ditch defensing suggesting a lack of positional awareness but more likely a lack of composure or skill to bring the ball out from the back. He attempted only 0.6 dribbles per 90 and of those he only completed 50%. To even further condemn him, Young’s greatest historical asset, his crossing also took a sharp nose dive in output with him making over 4.4. inaccurate long balls per 90 out of the 5.6 he attempts and only 1.5 out of every 3.4 corners he takes are accurate as well.

Using the underlying statistics, United’s defence have been the best in the league tgis yar showing how remarkable a turn around Wan-Bissaka has made. They are top for goals against, only allowing 4 and have conceded the 2nd most shots in the league. Their XGA sits at 3.31 placing them top of the league above the likes of Manchester City and Liverpool with the former having an XGA of 4.48. Despite them curently sitting in 6th, looking at expected points they seem to be faily unlucky with expected points suggesting that really they should be sitting in second place, behing Manchester City. Looking at last season, United were 11th for goals against at 54 and XGA had them at 52.8, placing them 8th.

Obviously the addition of Harry Maguire has had a proound impact on this sudden improvement in defensive stability however the midfield has arguably gotten weaker. United have lost the extrem coverage that Ander Herrera brought as he moved to PSG and despite being a positive sale they did lose another defensively sound player in Fellaini. With Scott McTominay being worshipped by many United fans, his underlying numbers are simply not that impressive and rank him as an average or slightly below average Premier League quality midfielder. Matic is also a year older and his legs seem to have gone whilst Juan Mata is being employed in a midfield 3 despite him being completely immobile and offering hardly any defensive contribution. It has all simply been lft to Paul Pogba, who has simply had to focus on chance creation with the lack of creativity in United’s midfield. This simply makes Wan-Bissaka’s numbers even more astounding.

But why is he the best, or most important? Why not give this title to Pogba, or Rashord or De Gea. Simply put, Wan-Bissaka has solved a poblem looming over United since the departure of Gary Neville, with many players such as Antonio Valnecia and Ashley Young have had to convert postions in orde to fill the glaring gap in United’s lineup. The accquisition of Wan-Bissaka provides a long term solution with a generational talent who arguably is already the most defensively sound right back in world football at the momemnt, with only the likes of Joshua Kimmich and Trent Alexander Arold really challenging him to the top overall right back claim. Already showing improvements in his attacking game, Wan-Bissaka is most certainly heading towards being one of the best players to ever play for this prestigous club.

The Team of … ICC Cricket World Cup 2019

Below is statistically the best team of the 2019 Cricket World Cup.

Opening Batsmen

Jason Roy

Although he is only 9th on the top run scorers list in the tournament and 4 other opening batsmen have scored more runs than him, Jason Roy has been such an incredibly important part of England’s world cup campaign. Amassing a considerable 443 runs in 8 matches , Roy has been crucial in getting England’s innings of to a flyer many times. The naturally aggressive batsmen has a strike rate of 115.36, putting him in the top 10 for the tournament. Despite this, however, Roy plays proper cricketing shots and is not just a pinch hitter sent to exploit the filding restrictions of the first powerplay. Averaging 63.29, Roy’s impact on the team can be seen when analysing the results of England’s matches, with England losing the 2 games that Roy didn’t play in (they only lost games in total)

Rohit Sharma

Probably the easiest decision of the whole team, this is simply a no-brainer. The top run scorer of the tournament with 648 runs, averaging an impressive 81 and striking at a respectable 98.33, Sharma has had the tournament of his life. He only fell slightly short of Sachin Tendulkar’s record of most runs in a single world cup campaign (674 runs). Tipped by Tendulkar as one of the players who could beat his total runs record in ODI cricket, Sharma formed the backone of India’s batting lineup, scoring a whopping 5 hundreds. His seemingly effortless stroke play is no less than mesmerising and I personally was taken aback with the ease at which he was scoring in his innings of 104 vs Bangladesh which I watched at Edgbaston. Scoring so many match winning innings, he comfortably slots into the team.

Honurable Mentions

  • David Warner – 647 runs, Avg. 71.88
  • Jonny Bairstow – 532 runs, Avg 48.36

Top – order Batsmen

Shakib Al Hasan

Carrying the weight of the entire nation on his back, Shakib is the perfect description of a genuine all rounder who could walk into any side. Shakib found the form of his life in the tournament, in a new role batting at number 3. Scoring 283% of their runs, Bangladesh’s hopes often rested on Shakib and he delivered so many times, scoring a total of 606 runs and averaging. He managed to secure the best batting average of the tournament of 86.57 whilst still mantaining a positive strike rate of 96 howing his pure ability to accumulate runs in a fast manner. Not only was his batting extremely valuable but his handy left arm spin was also utilised. Taking 11 wickets in the tournament, if this team were to actually play together then he would most definitely bowl a few overs, being the only front line spinner in the side.

Kane Williamson (C)

Kane Williamson has recieved many plaudits for not only his perfomances but the way that he has carried himself on and off the field, leading to him winning the player of the tounament award. Captaining the side, Williamson has often gotten New Zealand out of dire situations, carying his side home on multiple situations. This side needed a slightly more reseved and game aware player which is exactly what Kane Williamson entails. Striking at a modest 74, the Key to Williamson’s game is his ability to spend tim at the crease and to frustarate a bowling attack by building partnerships, accumulating runs by cashing in on the loose deliveries. The fighting spirit of Williamson and his resolv to not give away his wicket has led him to score 578 runs with his stand out knock being the 102* vs South Africa where he single-handdly won them the game, picking up the man of the match award.

Joe Root

The only genuine Englishmen to feature on this team, (all the other English players have technically immigrated from other countries) Root has been described to be the glue that ‘holds together’ the English batting line up. Although we are playing slightly below his favoured position of number 4, Root has been exceptionally impressive in the tournament, even for his own high standards. Scoring 556 runs in the tournament at a strike rate of 89.53, Root’s incredible ability of getting off strike often sees him accumulate runs at a pace that takes everyone by surprise, considering his fairly risk free aproach. Averaging 61.77 in the tounament, he would be a valuable addition to any sides middle order, being one of the most consistent performers in world cricket right now.

Honourable Mentions

  • Virat Kohli – 442 runs, Avg. 55.25
  • Babar Azam- 474 runs, Avg. 67.71

All-Rounders

Ben Stokes

The hero of the World Cup final and the winner of the player of the match award in the final, Ben Stokes has undoubtedly been the best all-rounder this tournament and has secured his claim as the best all-rounder in cricket. Accumulating 465 runs throughout the tournament at astrike rate of 93.83, there were several match winning performances from Stokes, including against South Africa and India. He was useful with the ball in the tounament taking 7 wickets and had the 17th best average economy of 4.83. Arguably England’s biggest star in a star-studded lineup, Stokes is a valuable addition to the batting and bowling lineup of any team, however, his most potent asset may be his fieding taking an incredible catch against South Africa in first game of the tournament, with a memorable bit of commentary going with it.

” No way! No no way! You cannot do that Ben Stokes. That is remarkable. That is one of the greatest catches of all time!”

Nasser Hussain

Jimmy Neesham

In this tournament Neesham proved why he is New Zealand’s most important all-rounder scoring 258 runs at an average of 36.85. He often combined with De Grandhomme to have several important patnerships towards the end of the innings getting his side to an above par score. Possibly the more impressive side to his game in the tournament was his bowling taking an impressive 15 wickets with his best figures of 5/31 against Afghanistan. Initially thought of as just a part time bowler, Neesham made a claim to being 5th choice bowler due to his consistently effective bowling with an impresssive bowling average of 19.46 and a bowling strike rate of 21.8. Best utilised in the middle overs, his economy of 5.35 is considerably low considering the situations he would often find himself in.

Honourable Mentions

  • Hardik Pandya – 10 wickets, 226 runs

Wicket-Keeper

Alex Carey

Easily the pick of the wicket-keepers, Carey came into the tournament under the radar with minial expectations on him from the average Australian cricket fan. Surprising everyone, Carey came 14th on the top run scorers list with 475 runs, despite consistently batting at 7. He outperformed many stars in the Aussie’s batting lineup such as Glenn Maxwell and Marcus Stoinis. Like many Australians of the past, Carey has that tough mentality that causes him to excel, for example, continuing to bat after taking a Jofra Archer bouncer to the chin. He was also competent with the gloves, totalling 20 dismissals with 18 catches and 2 stumpings. It seems like in this tournament Australia have finally found their long-term heir to Brad Haddin.

Honourable Mentions

  • Jos Buttler – 312 runs, 14 dismissals

Bowlers

Mitchell Starc

Considerably topping the wicket taker’s list with a whopping 27 wickets, Starc definitely deserves a spot on this list. His tally of 27 in the tournament also puts him top of the list of most wickets taken in a single world cup, breaking his fellow countrymen’s record, Glenn McGrath’s, of 26. Starc’s most dangerous asset is his inswinging yorker, unsuprisingly meaning a large poportion og his wickets come from bowled and LBW as he always looks to attack the stumps. His best figures ended up being 5-26, taking 5 wickets on two occasions during the tournament. Starc took a battering in the final game of the tournament which negatively affected a lot of his statistics such as his economy which is a modest 5.43. His bwling average of 18.59 places him 6th on the leaderboard and strike rate of 20.51 places him 3rd. Starc is simply the definition of a wicket taking bowler.

Jofra Archer

Securing his claim as England’s front line bowler in this tournament, Archer was able to prove to his critics why he deserved to be selected in the side despite only playing his first game for England in May 2019. Finishing 3rd on the wicket taker’s list with 20, Archer was crucial in getting many breakthroughs for England, especially in the tighter games. With an average of 24.55 and a strike rate of 30.85, Archer was able to take wickets regularly with his best figures being 3/27 vs South Africa showing that one game has not just popelled his stats unfairly. He was also able to build pressure with an impressive economy of 4.77, bowling 8 maidens in the tournament and having the most dot balls off his bowling than any other bowler. He was given the ball by captain Eoin Morgan in the finalsuper over, where he was able to hold his nerve and guide his side over the line.

Jasprit Bumrah

The pick of a strong Indian bowling attack thoughout the tournament, Bumrah has been crucial to India, taking imporant wickets and slowing down the pace of the innings. His incredibly impressive economy of 4.41 is even more impressive once considering that usually half of his overs are at the death. He has bowled the most maidens in the tournament with 8 and taken 18 wickets with one of his stand out performances being against Bangladesh where he finished with figures of 4-55. He averaged 20.61 with the ball and had a strike rate of 28. Bumrah often utilised his many variations which helped to bamboozle batsmen who would be unsure what to expect next. Gaining a few yards in the last couple of years, his sheer pace is becoming a greater challenge when combined with his unorthodox action.

Honourable mentions

  • Lockie Ferguson – 21 wickets, 4.88 economy
  • Trent Boult – 17 wickets, 4.83 economy

An introduction to … Expected assists

What are Expected Assists

Another football metric which is becoming increasingly more used is expected assists or xA. An assist, for those who may not know, is the final pass that directly leads to a goal. Every goal has a pass come before it, except for those which come from direct set pieces, so almost every goal will have another player accredited with an assist. The xA metric works in a similar way to xG, if you are unsure what expected goals are then read the previous article in the blog where we cover it in depth. The best definition of xA comes from Opta, who themselves produce their own model.

“Expected assists measures the likelihood that a pass will be a primary assist. The model is based on the finishing location of the pass, what type of pass it was and a variety of other factors. This model is not reliant on whether a shot was taken from this pass, so credits all passes, regardless of whether they result in a shot.”

Opta

Put simply, expected assists puts a value on passes and is essentially a measure used to assess the creativity of a player or a team. Just how xG shows the quality of chances a team has xA shows the quality of chance created by a pass, regardless of whether it leads to a goal.

To calculate xA, each pass by a player is given a value based on a data set of previously recorded passes and how likely it is that pass leads to a goal. As explained in Opta’s quote above, a variety of factors determine the final xA value of a pass but the most important one is the finishing location of the pass. For example, a sideways pass in the 6-yard box will have a much greater chance of a goal than a sideways pass at the halfway line. Another important factor is the type of pass with through balls, for example, scoring much higher than crosses on the xA metric as statistically crosses are a much less efficient way to score goals.

Why should we use Expected Assists

But why use the fairly complicated method to calculate xA and not just continue to use normal assists? Just like goals scored or conceded, assists can also often be equally misleading. This can simply be seen when analysing Lionel Messi’s goal vs Athletic Bilbao in the 2015 Copa del Rey final.

From that simple halfway line pass, Dani Alves would have registered an assist and scouts at the end of the season may have been oblivious to the magic of Messi to score from that position, skewing Alves’ data. Alves’ final assist numbers could then be fairly misrepresentative of his actual ability in chance creation, not giving scouts or coaches an accurate view of his true performance. However, when plugging this goal into the xA model, it can recognise the magic that must have happened for a goal to be scored from that pass. Unsurprisingly, the xA value of Alves’ pass would be less than 0.01 or put into words, less than 1% of the time a goal will occur due to that pass. However xA can also be used to recognise players that have been unlucky in not recieving assists as well as those who have been fortunate. In this video below the xA value of the final pass into the box is 0.96 however Uche (the player who makes the final pass) is not credited with the assist. You can judge how unfair this is by watching the video below.

The best part of xA is that all passes are registered i.e the pass does not need to result in a shot for it to be considered. This means that it doesn’t penalise a player for the team’s poor finishing, lack of intent to shoot or lack of dribbling skill to create space for a shot from a pass which the top strikers are able to do. If in that video above no one was able to get a shot of from Uche’s pass, the pass would still generate a high xA value due to the quality of that pass and the likelihood of scoring a goal from that pass in another scenario

Opta’s xA data from the 2016/17 Premier League season also shows how useful the metric is. Players such as De Bruyne and Eiksen are able to outperfom their expected assists showing their killer ability to create from tough situations as well as their team mates ability to finish these chances. Other players such as Eden Hazard and Marko Arnautovic are generating decent xA numbers however looking at their actual assists tally suggests taht their team mates finishing ability may be letting them down.

Simply, there is not better metric currently avaliable to assess chance creation than expected assists.

By Anmol Gupta

An Introduction to… Statistics in Football

(By football I don’t mean the American kind but the one that is also known as soccer)

Statistics are becoming increasingly more useful to help analyse the intricacies that are intertwined within the beautiful game. In recent years new measures have been developed to revert away from the often misleading simple statistics such as goals, assists and clean sheets. These never have and never will be able to truly indicate how talented a player is and cannot assess the full package that a player offers. With revolutionary new breakthroughs such as the introduction of possession adjusted statistics and the expected goals and expected assists model, scouts can gain a much better understanding of the quality of a player.

It is no surprise then that recruitment in many clubs, not just from Europe’s top five leagues, have embraced the statistical revolution that has taken place due to advancements in data science and machine learning. Companies such as Statsbomb, who specialise in football statistics, have been able to work with and guide recruitment for clubs in the Premier League, Bundesliga, Serie A and Ligue 1 but have branched out to work with sports teams from the MLS, Superliga and as far down as English Football League Two.

But why are statistics and analytics so important to the average football fan? Statistics can help fans to evaluate for themselves how valuable or not valuable players at their club are. During the turbulent phase, which is the transfer window, fans can make much better assessments by analysing data for their club over what types of players they need. For example, if the number of key passes and tackles and interceptions from the midfield were lower than clubs placed similarly in the table then a deep-lying playmaker with a formidable defensive output would be perfectly suited. Once analysing the statistics some of the top players that fit this mould are Frenkie De Jong, Toni Kroos and Marcelo Brozović

Looking at the radar graphs above it is clear to see why these two players would fit a club in desperate need of a deep-lying playmaker to give them more defensive solidity but yet provide creativity from the base of the midfield. Both Brozović and Kroos had strong key passes per 90, expected assists per 90 and expected goals build up per 90 numbers last season, showing how valuable they would be in a sides’ chance creation. Defensively, both are sound, with Brozović conducting a mammoth 4.6 tackles and interceptions per 90 in Serie A and an ageing Kroos still putting up 2.8 tackles and interceptions per game in the Nations League despite Germany dominating possession.

Statistics are also working this way into mainstream media with Match of the Day and Match of the Day 2 (British BBC programmes which show the highlights of the recent Premier League games and amass a viewership of 7 million people each weekend) show the expected goals of each team at the end of the game as well as the usual shots taken, possession etc.

For you, the average football fan, it is important to understand what these new statistics actually mean and why they are important otherwise you will be left behind as football turns towards a more statistical and analytical chapter.

By Anmol Gupta

No comments to show.